- The Inkwell
- Indiana
- Franklin College
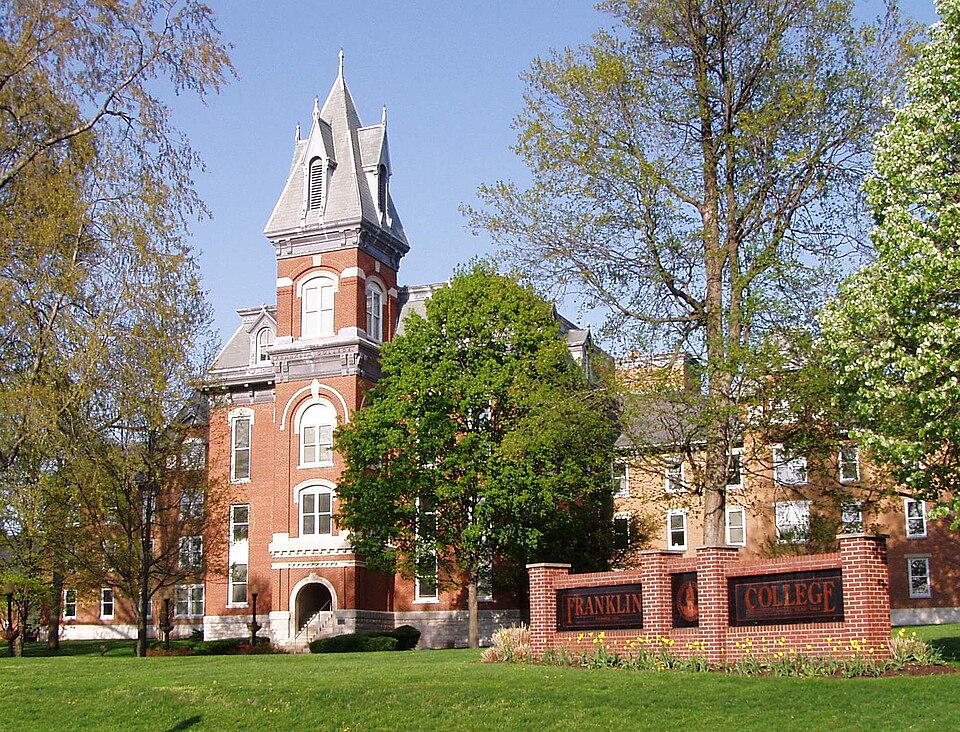
Franklin, INSuburb: largeZIP 46131Founded 1834
- Sector
- Private nonprofit
- Founded
- 1834
- Carnegie class
- Baccalaureate: arts & sciences focus
- Highest degree
- Graduate degree
- Federal aid since
- 1965
- Website
- www.franklincollege.edu
IndianaReligious affiliationPrivate nonprofit
Franklin College
Franklin College is a private nonprofit college in Franklin, Indiana, with 900 undergraduates. It admits 70% of applicants, graduates 58% within six years and costs $24,343 a year after aid.
58%graduate
Admission rate70%
Retention73%
4-year graduation54%
Pell Grant share40%
Federal loans55%
$24,343net price / year
70%admission rate
1145average SAT
58%graduate in 6 years
$61,877median earnings, 10 yrs
$22,678median debt
#696 of 1,704 for earnings#1,185 of 1,739 for lowest net price#742 of 1,738 for graduation rate#562 of 1,552 for selectivity
what it costs
Cost and net price
Net price is the average annual cost after grants and scholarships for full-time students who receive federal aid; it varies with family income.
Published cost
- Cost of attendance
- $56,433tuition, fees, housing, books, per year
- Tuition & fees, in-state
- $40,010
- Tuition & fees, out-of-state
- $40,010
- Average net price
- $24,343national median $19,980
Net price by family income
$0–30,000$19,466
$30,001–48,000$18,362
$48,001–75,000$18,303
$75,001–110,000$21,684
$110,001+$32,950
getting in
Admissions and test scores
Admission
- Admission rate
- 70%national median 77%
- Average SAT
- 1145
- SAT reading, middle 50%
- 540–620
- SAT math, middle 50%
- 520–620
- ACT composite, middle 50%
- 20–26
Against the national median
Admission rate · this college70%
Admission rate · U.S. median77%
Retention · this college73%
Retention · U.S. median76%
Graduation · this college58%
Graduation · U.S. median55%
Pell share · this college40%
Pell share · U.S. median39%
after enrolling
Graduation, earnings and debt
Completion
- Graduation rate, 6 years
- 58%within 150% of normal time
- Graduation rate, 4 years
- 54%
- First-year retention
- 73%
- Award within 8 years, all students
- 62%
Earnings and debt
- Median earnings, 6 years after entry
- $49,978
- Median earnings, 10 years after entry
- $61,877middle 50%: $44,319–$85,655
- Median debt at graduation
- $22,678
- 3-year loan default rate
- 0%
Earnings ten years after entry
Upper quarter$85,655
Median, Franklin College$61,877
Lower quarter$44,319
U.S. median, all colleges$58,886
Former students working and not enrolled · College Scorecard
who studies here
Students and faculty
Undergraduates
- Degree-seeking undergraduates
- 900
- Part-time
- 1.2%
- Women / men
- 50% / 50%
- Average age at entry
- 19.9
- First-generation students
- 29%
- Pell Grant recipients
- 40%
Faculty and resources
- Student-to-faculty ratio
- 12 : 1
- Full-time faculty
- 73%
- Average faculty salary
- $7,146 / month
- Instructional spending per student
- $10,297
- Endowment, end of year
- $99,752,531
Race and ethnicity, undergraduates
White77%
Hispanic5.4%
Black6.2%
Asian1.1%
Two or more races4.6%
U.S. nonresident4.8%
American Indian / Alaska Native0.2%
Native Hawaiian / Pacific Islander0.1%
Unknown0.4%
14 fields of study
Most popular fields
Share of bachelor’s degrees awarded, by broad field (CIP family).
Parks, recreation & fitness15%
Communication & journalism14%
Biological & biomedical sciences14%
Business & management13%
Psychology8.5%
Social sciences8.5%
Physical sciences5.7%
Computer & information sciences5.1%
keep comparing
Similar colleges
Private nonprofit colleges in Indiana
| College | Net price | Grad. | Earnings |
|---|---|---|---|
| Wabash College Crawfordsville, IN | $23,532 | 73% | $71,578 |
| Manchester University North Manchester, IN | $20,763 | 48% | $60,682 |
| Saint Mary-of-the-Woods College Saint Mary of the Woods, IN | $22,507 | 49% | $47,279 |
| Bethel University Mishawaka, IN | $19,971 | 60% | $54,006 |
| Goshen College Goshen, IN | $13,404 | 59% | $61,420 |
| Hanover College Hanover, IN | $20,095 | 68% | $59,112 |
Same Carnegie class, similar price
| College | Net price | Grad. | Earnings |
|---|---|---|---|
| Hampshire College Amherst, MA | $23,030 | 58% | $47,422 |
| Millsaps College Jackson, MS | $25,728 | 58% | $65,503 |
| Westminster College Fulton, MO | $23,913 | 55% | $57,881 |
| Whittier College Whittier, CA | $24,940 | 55% | $68,254 |
| Cornell College Mount Vernon, IA | $25,297 | 60% | $57,224 |
| Linfield University McMinnville, OR | $24,882 | 62% | $81,101 |
Source: College Scorecard, U.S. Department of Education — institution file, most recent cohorts. UNITID 150604. Founding year, motto and memberships: Wikidata Q5491372.